Holmes, Speed & Balding - Genetic Epidemiology 2019
Summary statistic analyses can mistake confounding bias for heritability
Abstract
Linkage disequilibrium SCore regression (LDSC) has become a popular approach to estimate confounding bias, heritability, and genetic correlation using only genome‐wide association study (GWAS) test statistics. SumHer is a newly introduced alternative with similar aims. We show using theory and simulations that both approaches fail to adequately account for confounding bias, even when the assumed heritability model is correct. Consequently, these methods may estimate heritability poorly if there was an inadequate adjustment for confounding in the original GWAS analysis. We also show that the choice of a summary statistic for use in LDSC or SumHer can have a large impact on resulting inferences. Further, covariate adjustments in the original GWAS can alter the target of heritability estimation, which can be problematic for test statistics from a meta‐analysis of GWAS with different covariate adjustments.
John B. Holmes, Doug Speed, David J. Balding (2019). Summary statistic analyses can mistake confounding bias for heritability. Genetic Epidemiology. First published: 20 September 2019 https://doi.org/10.1002/gepi.22259
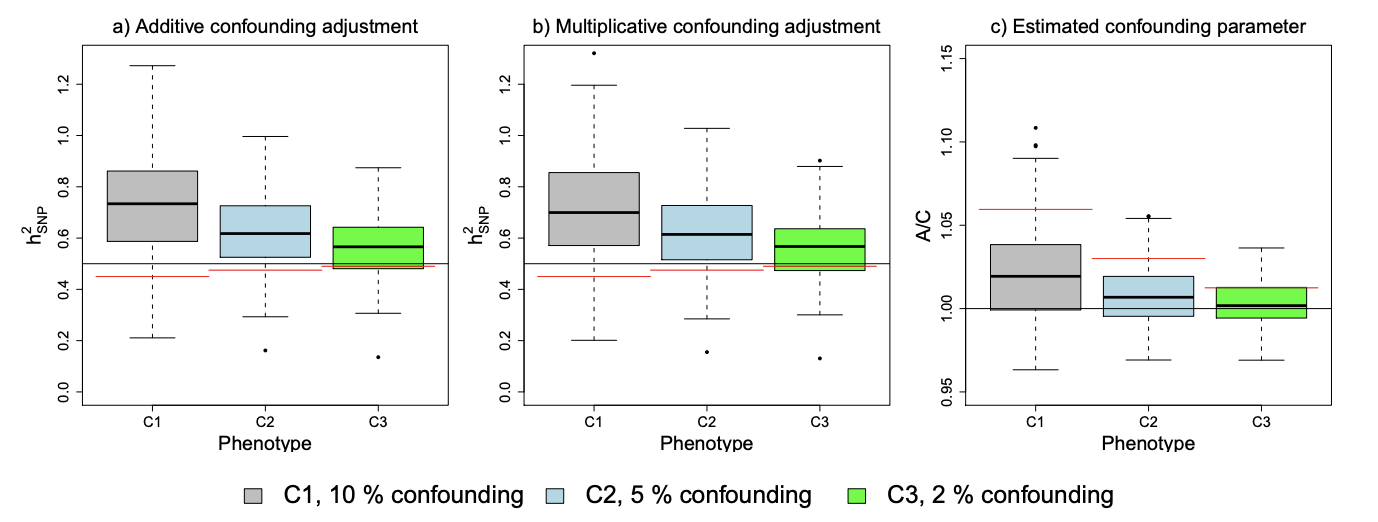
Figure 4: Estimating h 2 SNP and confounding parameters from phenotypes when h 2 SNPa = 0.5 and 10% (C1), 5% (C2) and 2% (C3) of phenotypic variance due to confounding. See Figure 3 for details of the confounding. The black lines in (a,b) indicate the simulated value of h 2 SNPa and the red lines the simulated value of h 2 SNPb, while the box plot shows the distribution of estimates when applying the confounding adjustment indicated in the plot heading. In (c), the black line corresponds to A/C = 1 corresponds to zero confounding bias and the red line the mean level of confounding, estimated as S¯ j − 1 − n P i r 2 ijh 2 j,b . Note that the y-axis differs between (a,b) and (c).