Balding - PLoS Genetics
How Convincing is a Y-Chromosome Profile Match?
A new way of presenting Y chromosome evidence in court clarifies the sometimes misleading DNA arguments used in sexual assault cases...see David Balding's Pursuit article here.
The article is open access and available here.
Mikkel Andersen has also produced a short video clip here.
Andersen MM, Balding DJ (2017) How convincing is a matching Y-chromosome profile? PLoS Genet13(11): e1007028. https://doi.org/10.1371/journal.pgen.1007028
Y-chromosome DNA profiles are important in forensic science, particularly when a male has been accused of assaulting a female. However, unlike for autosomal profiles, the problem of evaluating weight-of-evidence for Y profiles has not been satisfactorily resolved despite many attempts. The key idea missing from current approaches is that Y-profile matches are due to patrilineal relatedness that is typically too remote to be recognized, but close compared with the relatedness of random pairs from the population.
MIG's David Balding and colleagues focus on approximating the number of males with matching Y profiles, rather than a population fraction or match probability. They describe a simulation model of Y profile evolution, implemented in open-source software, for approximating the number of males sharing a Y profile. They extend their simulation method to also model database selection. Even under the optimistic assumption that the database has been sampled randomly in the relevant population, they show that database counts don’t help much. The reason is that modern profiling kits with high profile mutation rates imply that almost all profiles are rare relative to typical database sizes.
They discuss how to use our approach to present evidence in court in a way that is both fair and easy to understand.
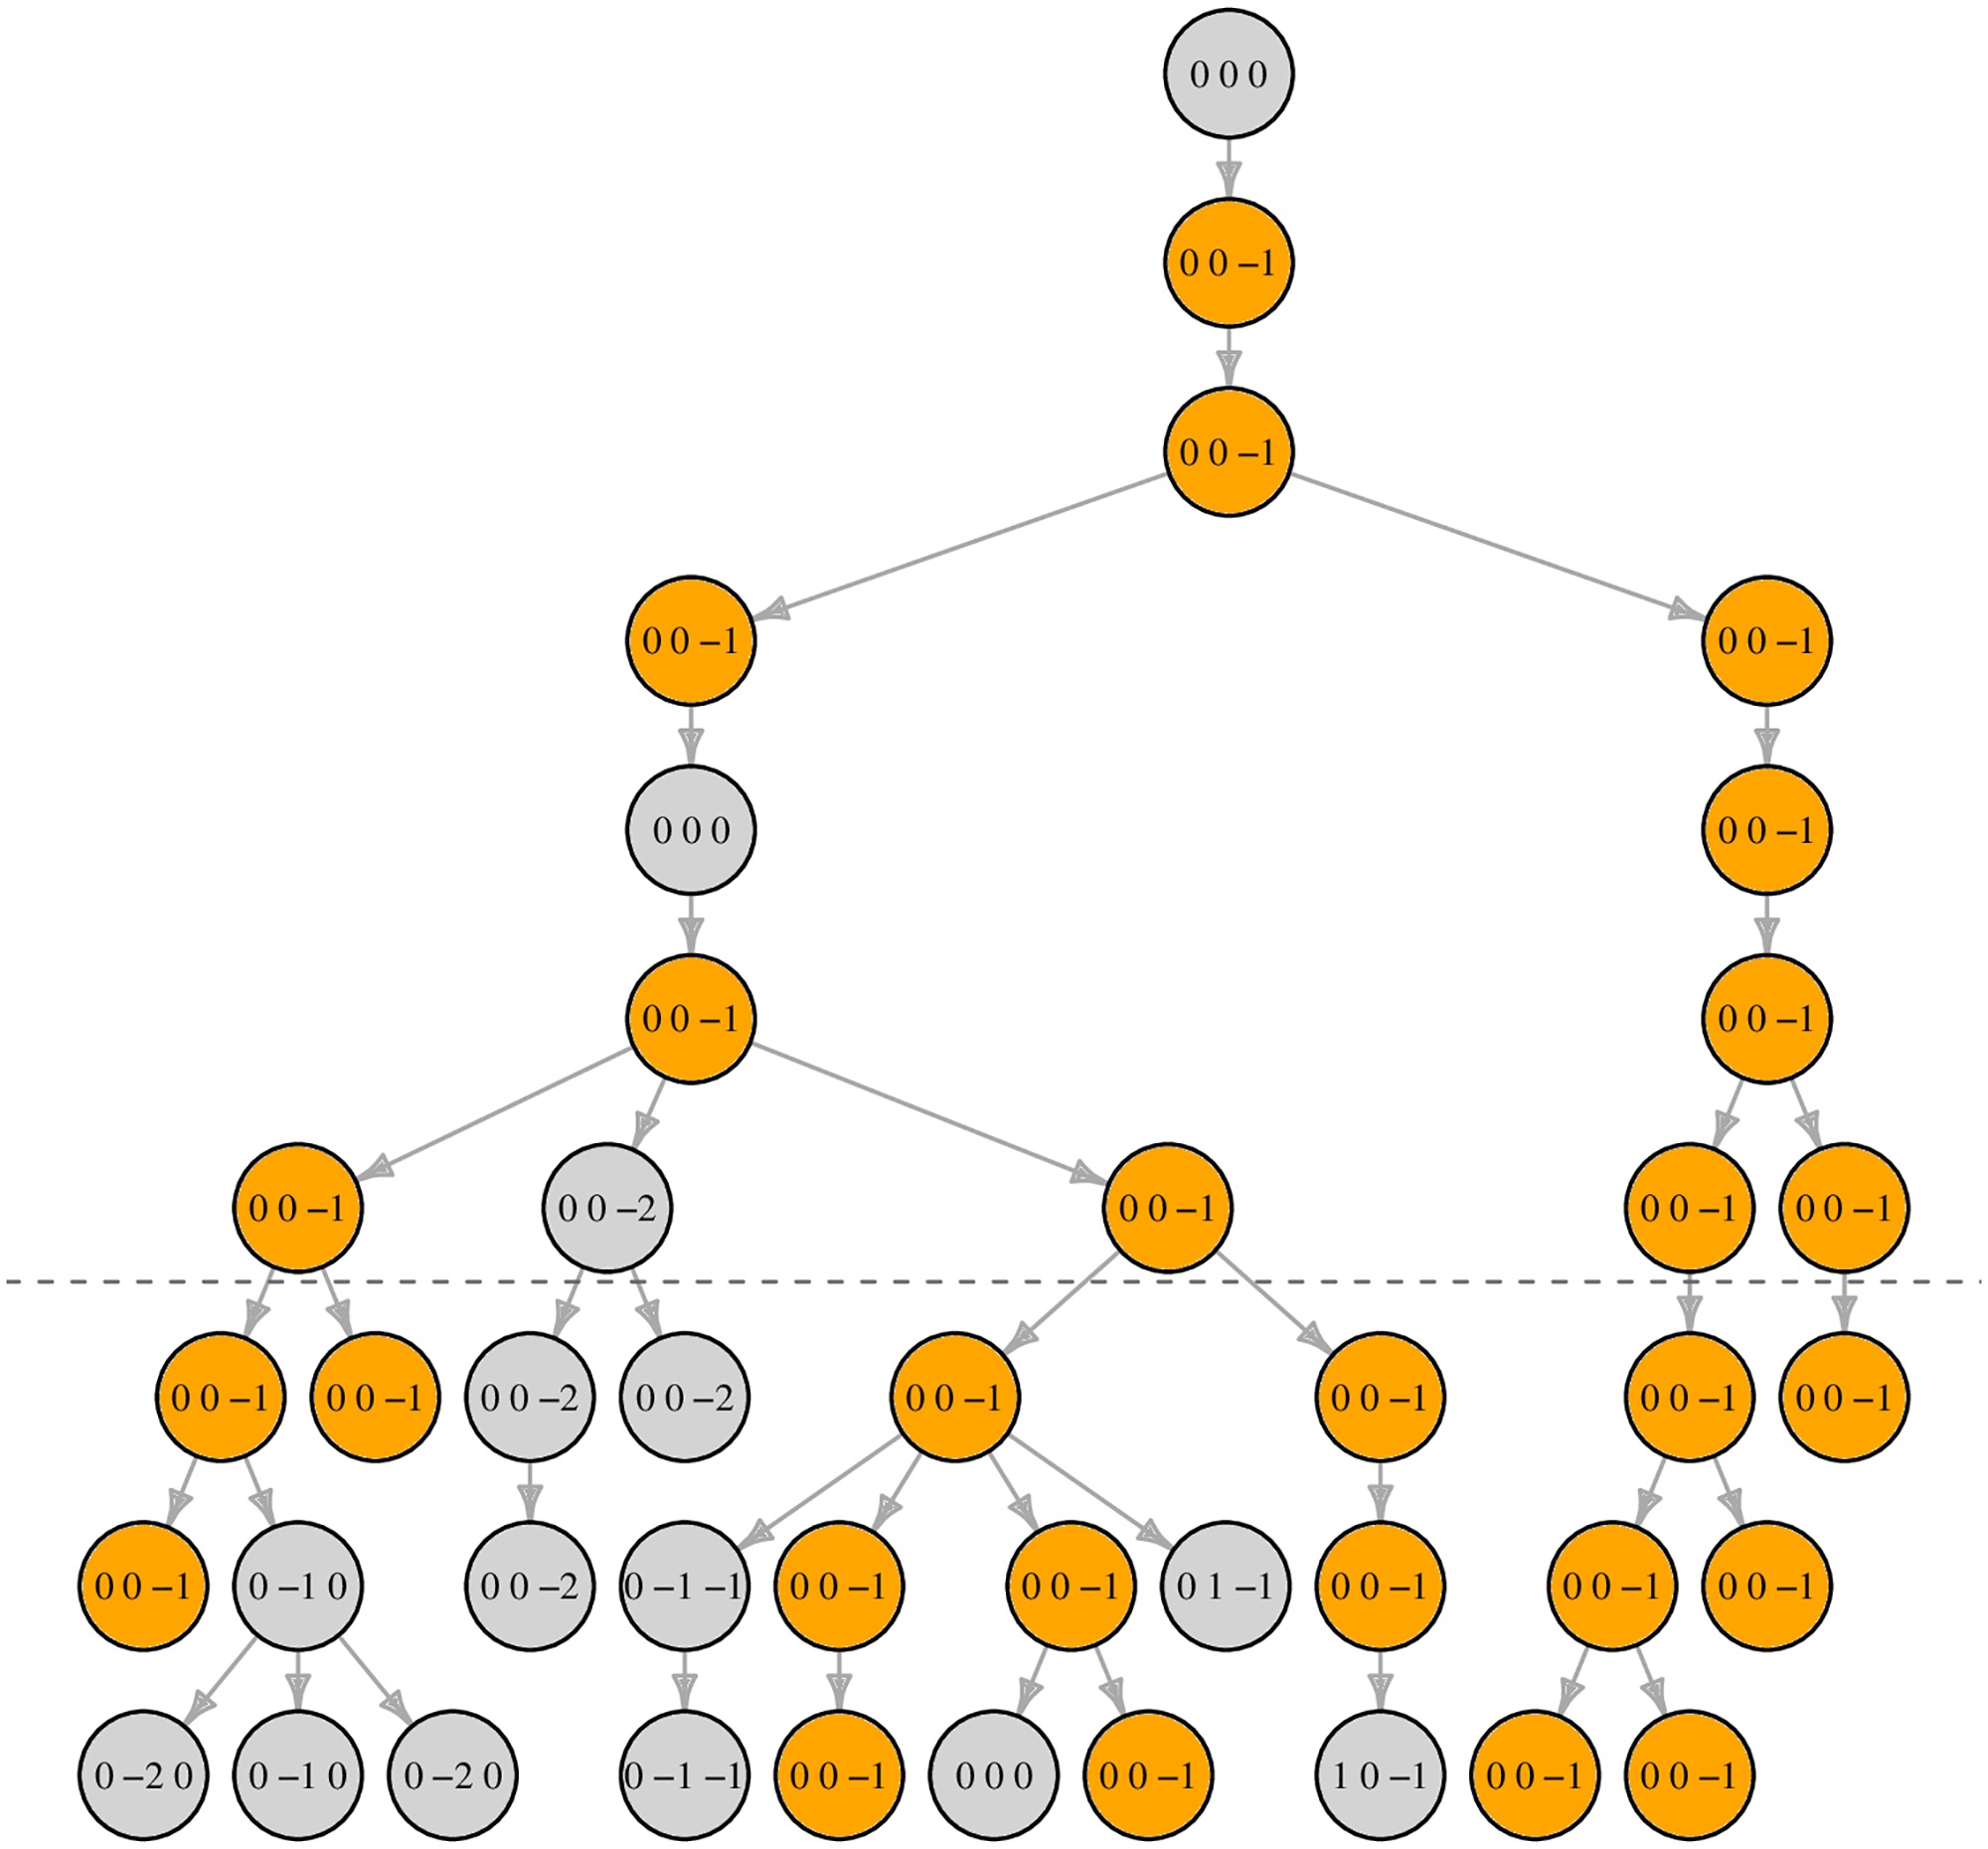
Figure 2 | Simulation process illustrated.
Simplified illustration of the process of counting haplotype matches (here, 3-locus haplotypes simulated over 10 generations with mutation rate 0.1 per locus per generation). Below the dashed line circles indicate males in the final three generations, who we label “live”. A live male Q was sampled and observed to have haplotype (0, 0, −1). The figure shows the founder that is ancestral to Q and all descendants of that founder, highlighting in orange those with haplotype (0, 0, −1). In this instance there are 16 live males with haplotype (0, 0, −1); any of these 16 could be Q—the resulting figure would be the same.